A powerful, plug-and-play debugging panel for WebViews, PWAs, and web apps. Inspect storage, track network calls, edit url, monitor console errors, and check browser capabilities — all directly inside your app, without USB cables or external DevTools.
If you’ve ever struggled to debug a mobile WebView… this tool is built for you.
npm install @sahiljena/react-webview-debugger
# or
yarn add @sahiljena/react-webview-debuggerDrop it anywhere in your app:
"use client";
import { DebuggerTool } from "@sahiljena/react-webview-debugger";

export default function App() {
  return (
    <>
      <DebuggerTool />
      <h1>My App</h1>
    </>
  );
}
That’s it. The debugger immediately starts capturing:
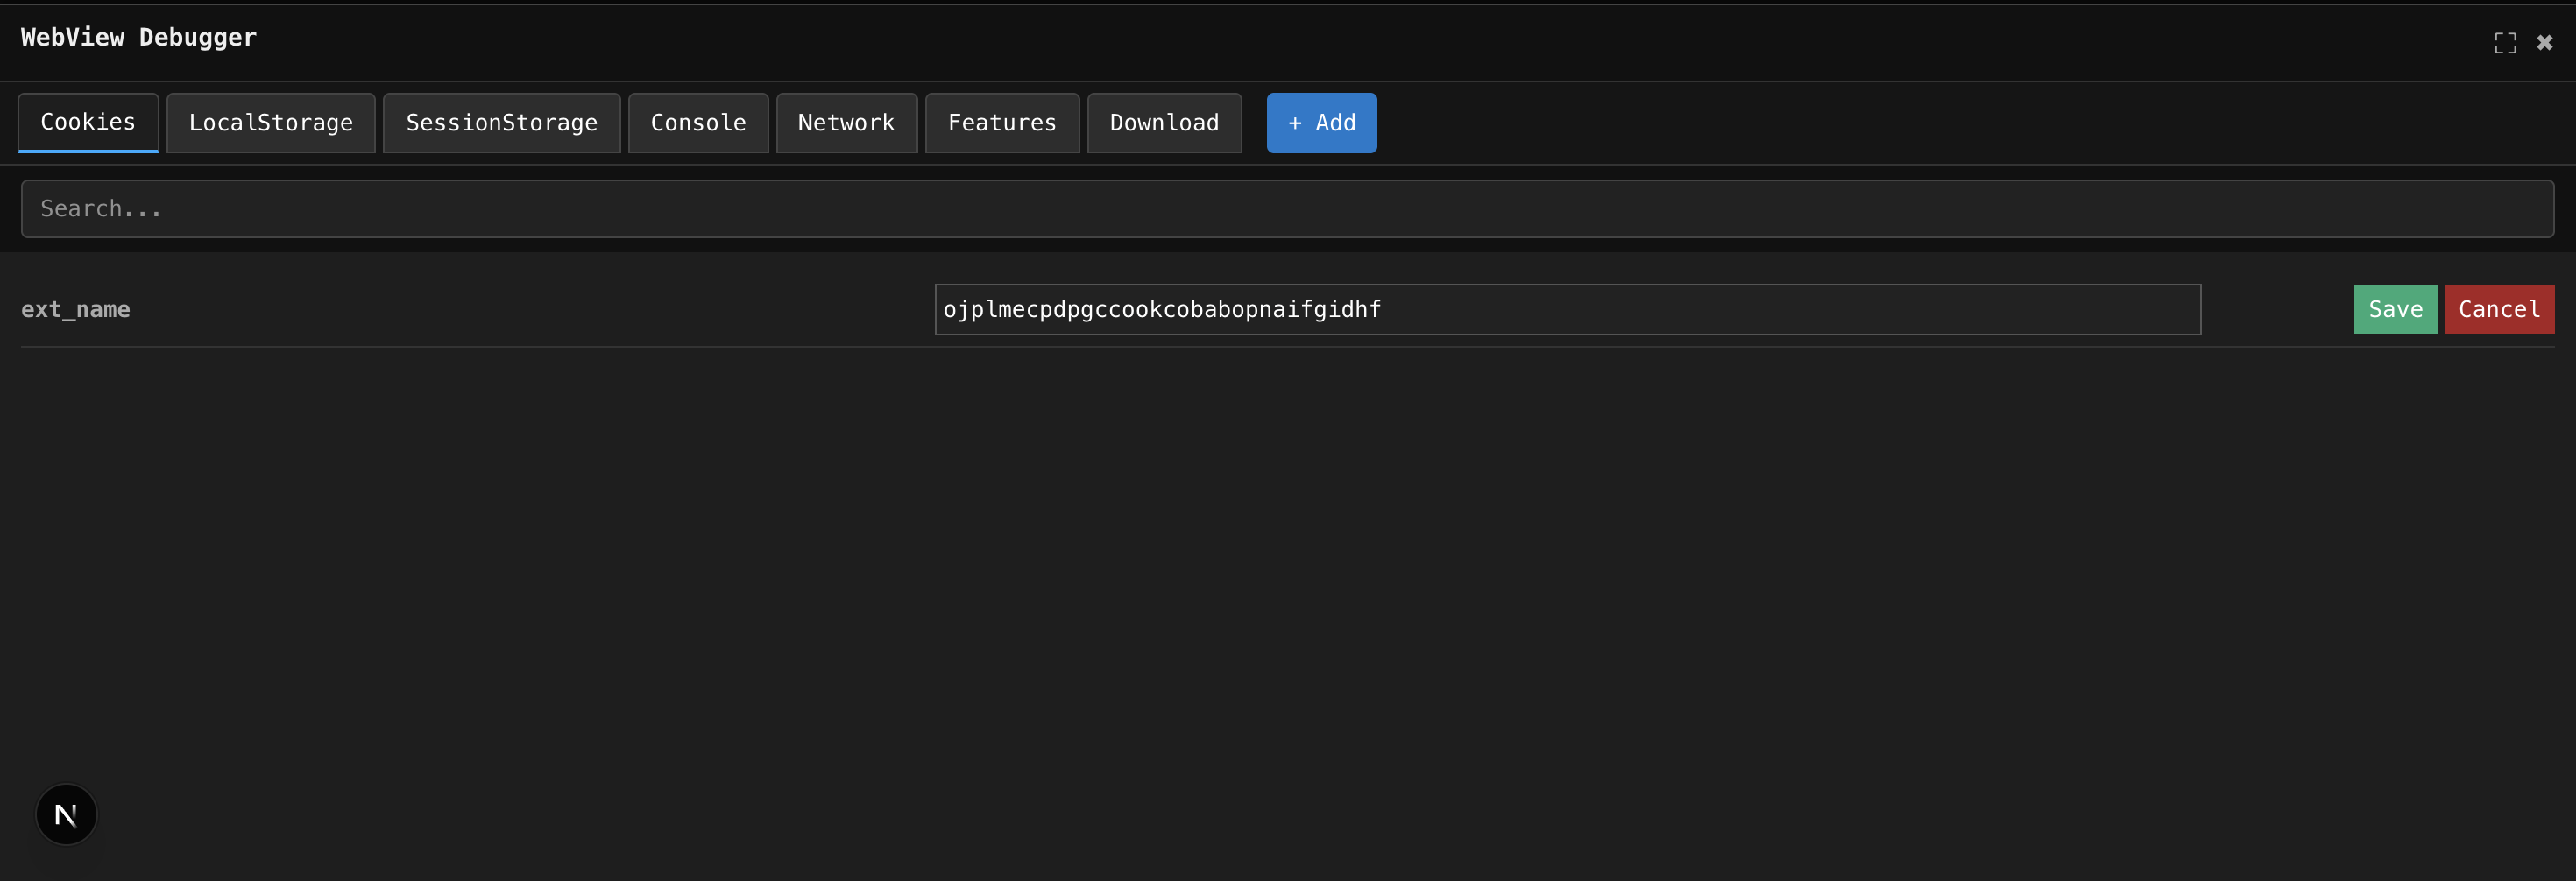
- Cookies
- localStorage & sessionStorage
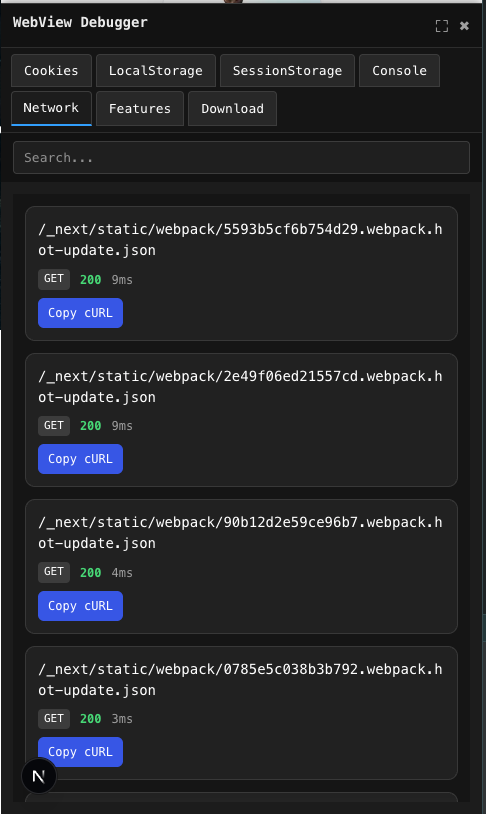
- Network requests and cURL
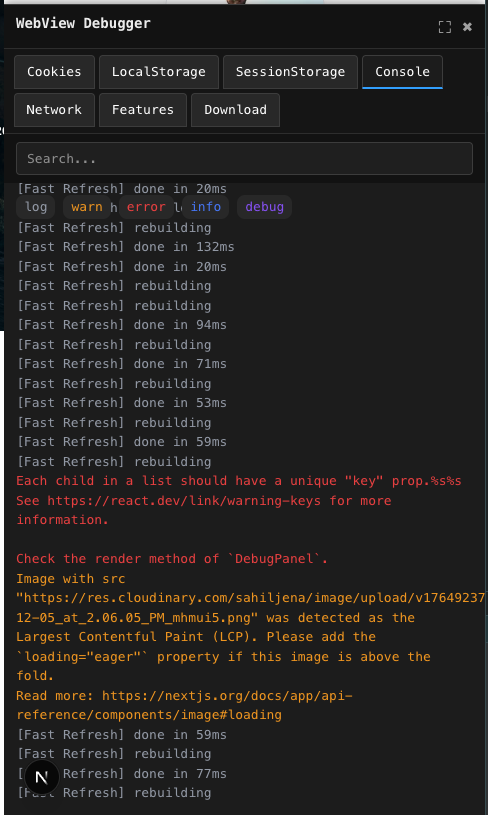
- Fully functional console
- URL Editor
- Environment features like
SharedArrayBuffer
No setup. No configuration. No hassle.
- Live inspection of cookies, localStorage, and sessionStorage
- Edit, delete, and create storage entries effortlessly
- Real-time console tracking
- URL Editor change webview url easily
- Network request viewer with searchable logs
- One-click export: Receive a compressed JSON containing everything
- Feature detector: Instantly check browser API support
Add an environment flag to show the debugger only in dev builds:
{
  process.env.NEXT_PUBLIC_DEBUG === "true" && <DebuggerTool />;
}
Note: Console & network logs refresh when switching between tabs (auto-refresh coming soon).
- GitHub: https://github.com/sahiljena/react-webview-debugger
- NPM: https://www.npmjs.com/package/@sahiljena/react-webview-debugger
MIT © Sahil Jena