Datasette plugin to create interactive data dashboards

![]()


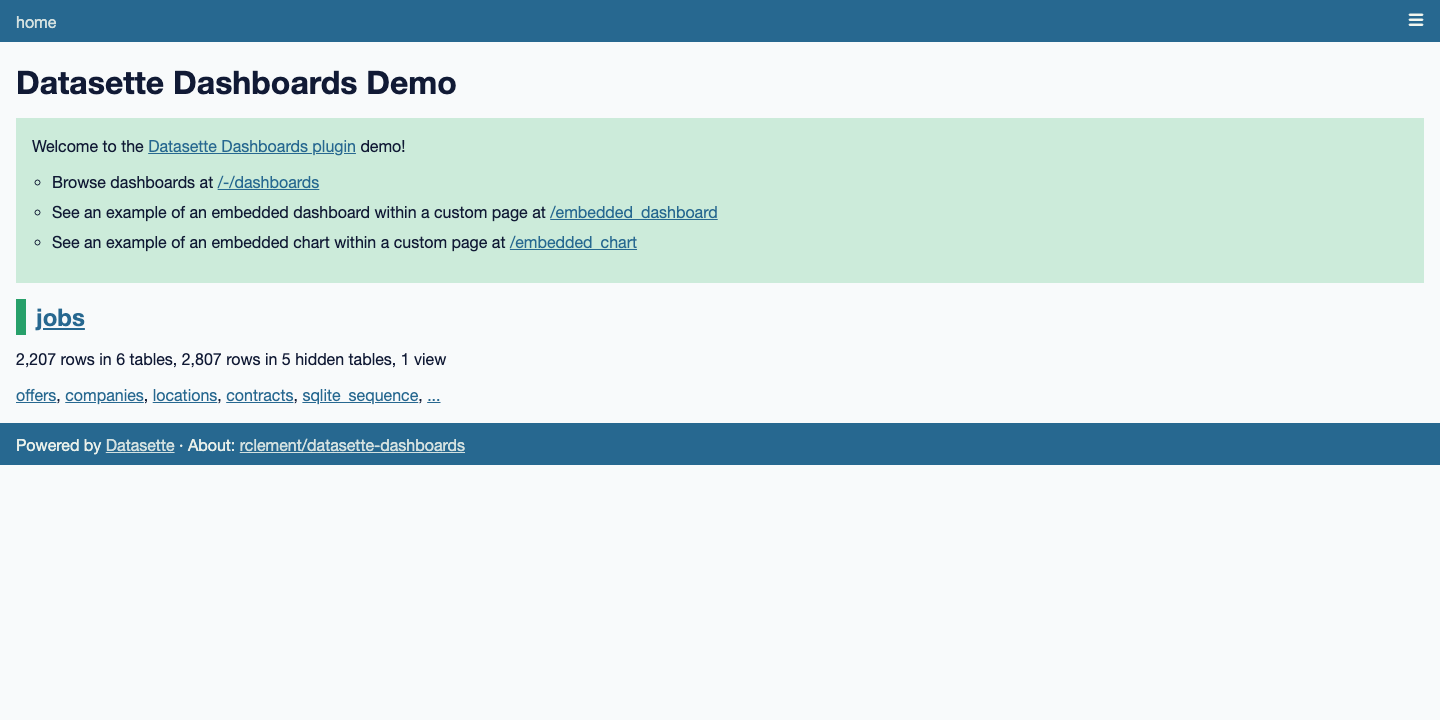
The Datasette Dashboards plugin allows to create interactive data visualisation dashboards in a declarative manner using the Datasette metadata configuration file. Coupled with a version control system such as Git, it transforms you Datasette instance into a BI as Code (Business Intelligence as Code) tool.
Try out a live demo at https://datasette-dashboards-demo.vercel.app
| Home | Dashboards list |
|---|---|
 |
 |
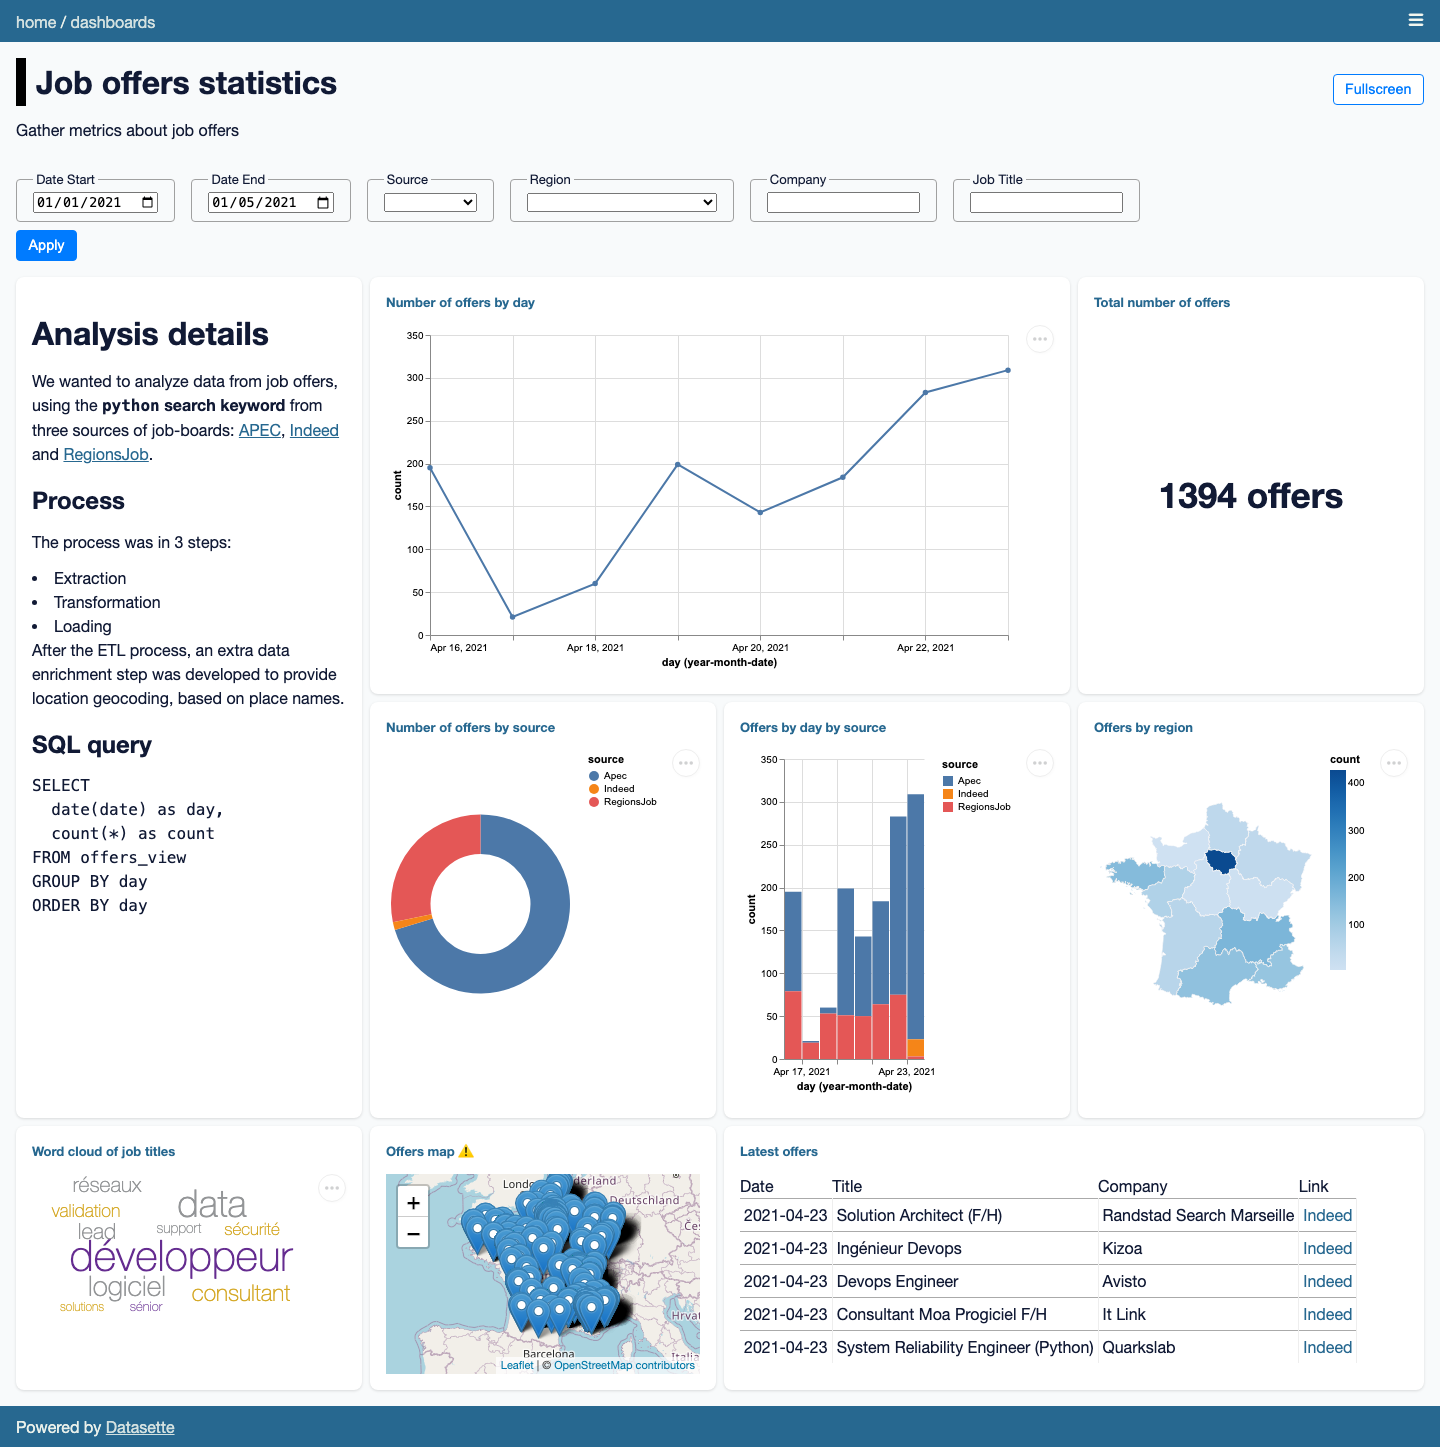
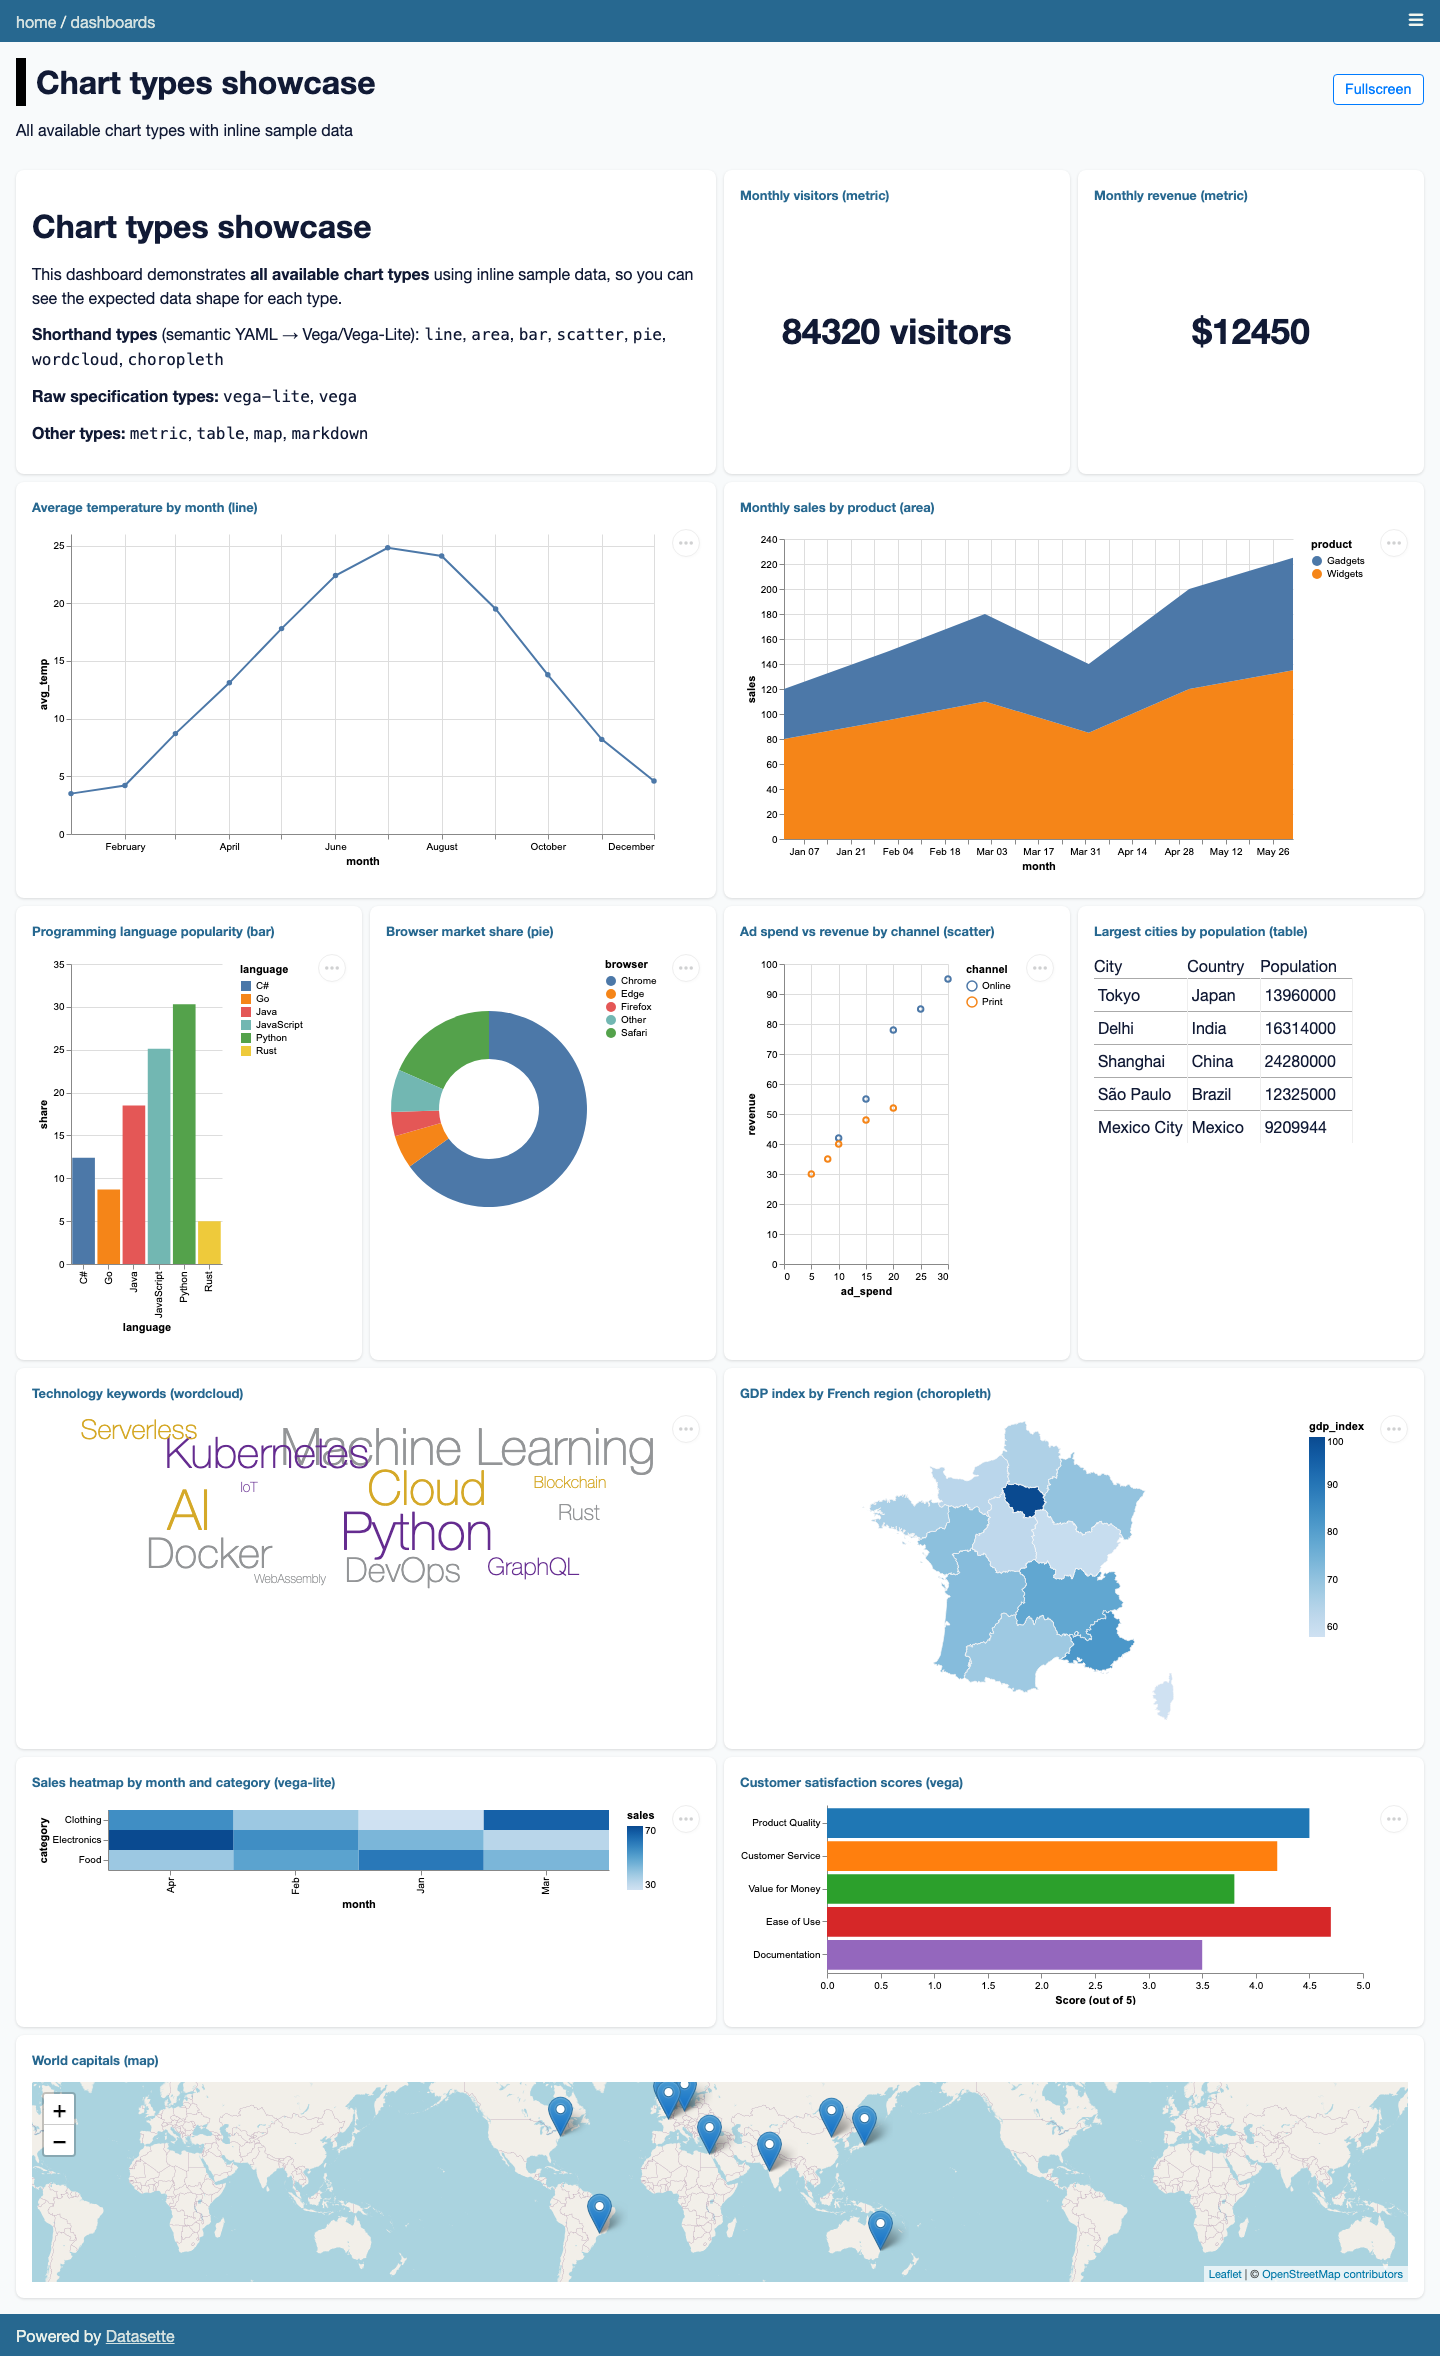
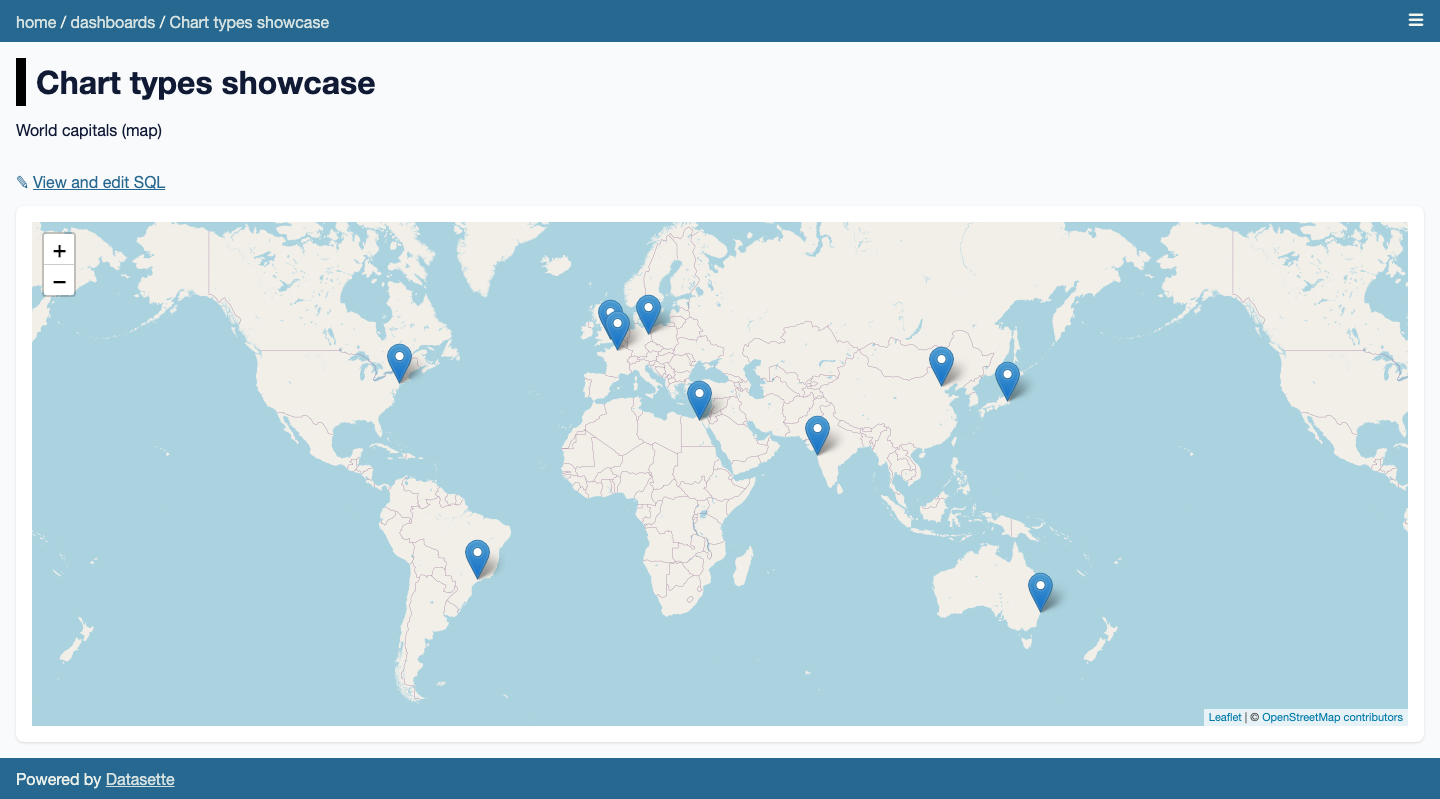
| Job offers dashboard | Chart types showcase |
|---|---|
 |
 |
| Single chart view |
|---|
 |
Install this plugin in the same environment as Datasette:
$ datasette install datasette-dashboardsDefine dashboards within metadata.yml / metadata.json:
plugins:
datasette-dashboards:
my-dashboard:
title: My Dashboard
description: Showing some nice metrics
layout:
- [analysis-note, events-count]
- [analysis-note, events-source]
filters:
date_start:
name: Date Start
type: date
default: "2021-01-01"
date_end:
name: Date End
type: date
category:
name: My Category
type: select
options: [Option 1, Option 2, Option 3]
dynamic_category:
name: My Dynamic Category
type: select
db: jobs
query: SELECT DISTINCT col1 FROM mytable ORDER BY col1 ASC
dependent_filter:
name: My Dependent Filter
type: select
db: jobs
query: SELECT DISTINCT col2 FROM mytable WHERE col2 IS NOT NULL [[ AND col1 = :dynamic_category ]] ORDER BY col2 ASC
charts:
analysis-note:
library: markdown
settings:
extensions:
- attr_list
extra_attrs:
h1:
- name
display: |-
# Analysis notes {: name="notes" }
> A quick rundown of events statistics and KPIs
events-count:
title: Total number of events
db: jobs
query: SELECT count(*) as count FROM events
library: metric
display:
field: count
prefix:
suffix:
events-source:
title: Number of events by source
db: jobs
query: SELECT source, count(*) as count FROM events WHERE TRUE [[ AND date >= date(:date_start) ]] [[ AND date <= date(:date_end) ]] GROUP BY source ORDER BY count DESC
library: pie
display:
label: source
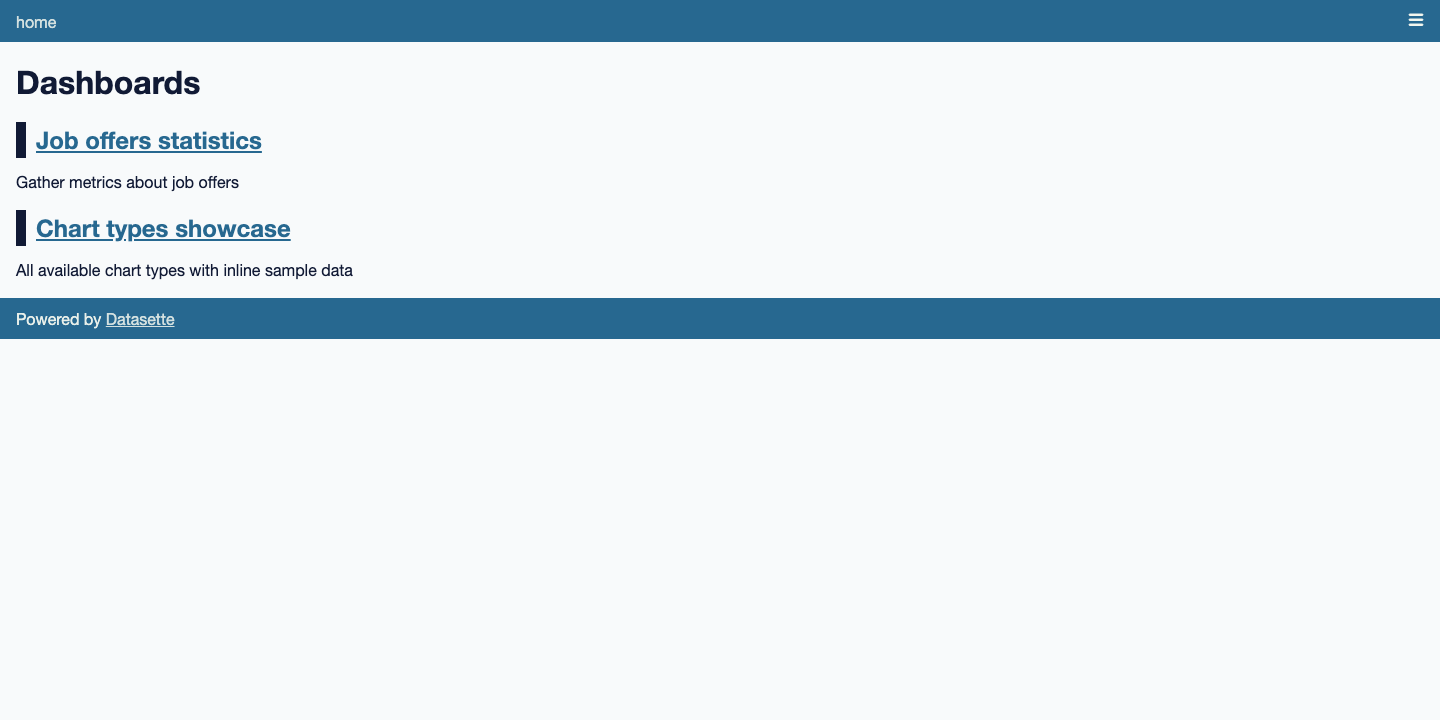
value: countA new menu entry is now available, pointing at /-/dashboards to access all defined dashboards.
Dashboard properties:
| Property | Type | Description |
|---|---|---|
title |
string |
Dashboard title |
description |
string |
Dashboard description |
settings |
object |
Dashboard settings |
layout |
array |
Dashboard layout |
filters |
object |
Dashboard filters |
Dashboard settings:
| Property | Type | Description |
|---|---|---|
allow_fullscreen |
bool |
Allow dashboard to be toggled in fullscreen (default false) |
autorefresh |
number |
Auto-refresh timeout in minutes |
Dashboard filters:
| Property | Type | Description |
|---|---|---|
name |
string |
Filter display name |
type |
string |
Filter type (text, date, number, select) |
default |
string, number |
(optional) Filter default value |
min |
number |
(optional) Filter minimum value |
max |
number |
(optional) Filter maximum value |
step |
number |
(optional) Filter stepping value |
options |
list |
(optional) Select filter options list |
db |
string |
(optional) Dynamic select filter database |
query |
string |
(optional) Dynamic select filter query |
Common chart properties for all chart types:
| Property | Type | Description |
|---|---|---|
title |
string |
Chart title |
db |
string |
Database name against which to run the query |
query |
string |
SQL query to run and extract data from |
library |
string |
One of supported libraries: line, bar, area, scatter, pie, choropleth, wordcloud, vega, vega-lite, markdown, metric, table, map |
display |
object |
Chart display specification (depend on the used library) |
To define SQL queries using dashboard filters:
SELECT * FROM mytable [[ WHERE col >= :my_filter ]]SELECT * FROM mytable WHERE TRUE [[ AND col1 = :my_filter_1 ]] [[ AND col2 = :my_filter_2 ]]Important notes:
- When a
selectfilter has more than 100 options, the dropdown list will be automatically converted to a text filter with autocompletion
The following shorthand chart types use a simple semantic YAML configuration
that is automatically converted to Vega-Lite (or Vega, for wordcloud) under the hood,
as opposed to providing a raw Vega / Vega-Lite specification directly.
Each example below includes a full chart definition with an inline SQL dataset so you
can see how query column names are reused in display.
| Property | Type | Description |
|---|---|---|
library |
string |
Must be set to line |
display.x |
string |
Field name for the X axis (default type: temporal) |
display.y |
string |
Field name for the Y axis (default type: quantitative) |
display.color |
string |
(optional) Field name for color grouping (type: nominal) |
display.xtype |
string |
(optional) Vega-Lite type for X axis (overrides default) |
display.ytype |
string |
(optional) Vega-Lite type for Y axis (overrides default) |
monthly-signups:
  title: Monthly signups
  db: demo
  query: |
    SELECT month, signups, segment
    FROM (VALUES
      ('2025-01-01', 120, 'Free'),
      ('2025-02-01', 150, 'Free'),
      ('2025-03-01', 180, 'Pro')
    ) AS monthly_signups(month, signups, segment)
  library: line
  display:
    x: month
    y: signups
    color: segment # optional
    xtype: temporal # optional
ytype: quantitative # optional| Property | Type | Description |
|---|---|---|
library |
string |
Must be set to area |
display.x |
string |
Field name for the X axis (default type: temporal) |
display.y |
string |
Field name for the Y axis (default type: quantitative) |
display.color |
string |
(optional) Field name for color grouping (type: nominal) |
display.xtype |
string |
(optional) Vega-Lite type for X axis (overrides default) |
display.ytype |
string |
(optional) Vega-Lite type for Y axis (overrides default) |
monthly-revenue:
  title: Monthly revenue
  db: demo
  query: |
    SELECT month, amount, plan
    FROM (VALUES
      ('2025-01-01', 1200, 'Starter'),
      ('2025-02-01', 1600, 'Starter'),
      ('2025-03-01', 2100, 'Business')
    ) AS monthly_revenue(month, amount, plan)
  library: area
  display:
    x: month
    y: amount
    color: plan # optional
    xtype: temporal # optional
ytype: quantitative # optional| Property | Type | Description |
|---|---|---|
library |
string |
Must be set to bar |
display.x |
string |
Field name for the X axis (default type: nominal) |
display.y |
string |
Field name for the Y axis (default type: quantitative) |
display.color |
string |
(optional) Field name for color grouping (type: nominal) |
display.horizontal |
boolean |
(optional) Flip axes for a horizontal bar chart (default: false) |
display.xtype |
string |
(optional) Vega-Lite type for X axis (overrides default) |
display.ytype |
string |
(optional) Vega-Lite type for Y axis (overrides default) |
tickets-by-priority:
  title: Tickets by priority
  db: demo
  query: |
    SELECT priority, ticket_count, team
    FROM (VALUES
      ('P1', 7, 'Support'),
      ('P2', 14, 'Support'),
      ('P3', 23, 'Platform')
    ) AS ticket_totals(priority, ticket_count, team)
  library: bar
  display:
    x: priority
    y: ticket_count
    color: team # optional
    horizontal: false # optional
    xtype: nominal # optional
ytype: quantitative # optional| Property | Type | Description |
|---|---|---|
library |
string |
Must be set to scatter |
display.x |
string |
Field name for the X axis (default type: quantitative) |
display.y |
string |
Field name for the Y axis (default type: quantitative) |
display.color |
string |
(optional) Field name for color grouping (type: nominal) |
display.size |
string |
(optional) Field name for point size (type: quantitative) |
display.xtype |
string |
(optional) Vega-Lite type for X axis (overrides default) |
display.ytype |
string |
(optional) Vega-Lite type for Y axis (overrides default) |
price-vs-rating:
  title: Price versus rating
  db: demo
  query: |
    SELECT price, rating, category, sales
    FROM (VALUES
      (19.0, 4.1, 'Books', 80),
      (49.0, 4.6, 'Gadgets', 120),
      (79.0, 4.8, 'Gadgets', 95)
    ) AS products(price, rating, category, sales)
  library: scatter
  display:
    x: price
    y: rating
    color: category # optional
    size: sales # optional
    xtype: quantitative # optional
ytype: quantitative # optional| Property | Type | Description |
|---|---|---|
library |
string |
Must be set to pie |
display.label |
string |
Field name for slice labels (type: nominal) |
display.value |
string |
Field name for slice values (type: quantitative) |
sales-share:
  title: Sales share by channel
  db: demo
  query: |
    SELECT channel, revenue
    FROM (VALUES
      ('Organic', 5400),
      ('Paid', 3100),
      ('Partner', 1500)
    ) AS channels(channel, revenue)
  library: pie
  display:
    label: channel
value: revenue| Property | Type | Description |
|---|---|---|
library |
string |
Must be set to choropleth |
display.label |
string |
Field name containing feature labels to match against GeoJSON |
display.value |
string |
Field name containing the numeric value used for coloring |
display.geodata_url |
string |
URL to a GeoJSON file |
display.geodata_key |
string |
Property path in GeoJSON features to match on (e.g. properties.nom) |
display.projection |
string |
(optional) Vega-Lite projection type (default: mercator) |
display.color_scheme |
string |
(optional) Vega color scheme name (default: blues) |
population-by-region:
  title: Population by region
  db: demo
  query: |
    SELECT region_code, population
    FROM (VALUES
      ('11', 12278210),
      ('24', 588000),
      ('32', 3315000)
    ) AS region_stats(region_code, population)
  library: choropleth
  display:
    label: region_code
    value: population
    geodata_url: https://example.com/fr-regions.geojson
    geodata_key: properties.code
    projection: mercator # optional
color_scheme: blues # optional| Property | Type | Description |
|---|---|---|
library |
string |
Must be set to wordcloud |
display.text |
string |
Field name containing the words |
display.size |
string |
Field name containing word frequency / size values |
display.colors |
list |
(optional) List of color hex strings (default: ["#d5a928", "#652c90", "#939597"]) |
display.font |
string |
(optional) Font family (default: Helvetica Neue, Arial) |
display.rotate |
number |
(optional) Rotation angle in degrees (default: 0) |
display.font_size_range |
[number, number] |
(optional) [min, max] font size range (default: [12, 56]) |
display.height |
number |
(optional) Chart height in pixels (default: 200) |
top-keywords:
  title: Top keywords
  db: demo
  query: |
    SELECT keyword, frequency
    FROM (VALUES
      ('sqlite', 42),
      ('datasette', 35),
      ('dashboard', 20)
    ) AS keyword_counts(keyword, frequency)
  library: wordcloud
  display:
    text: keyword
    size: frequency
    colors: ["#d5a928", "#652c90", "#939597"] # optional
    font: Helvetica Neue, Arial # optional
    rotate: 0 # optional
    font_size_range: [12, 56] # optional
height: 200 # optionalAvailable configuration for vega charts:
| Property | Type | Description |
|---|---|---|
library |
string |
Must be set to vega |
display |
object |
Vega specification object |
Notes about the display property:
- Requires a valid Vega specification object
- Some fields are pre-defined:
$schema,description,autosize,data,signals - All fields are passed along as-is (overriding pre-defined fields if any)
- Only
markandencodingfields are required as the bare-minimum
vega-custom:
  title: Custom Vega chart
  db: demo
  query: |
    SELECT month, amount
    FROM (VALUES
      ('2025-01-01', 100),
      ('2025-02-01', 140),
      ('2025-03-01', 90)
    ) AS monthly_sales(month, amount)
  library: vega
  display:
    width: container # optional
    mark: line
    encoding:
      x:
        field: month
        type: temporal
      y:
        field: amount
type: quantitativeAvailable configuration for vega-lite charts:
| Property | Type | Description |
|---|---|---|
library |
string |
Must be set to vega-lite |
display |
object |
Vega specification object |
Notes about the display property:
- Requires a valid Vega-Lite specification object
- Some fields are pre-defined:
$schema,description,width,view,config,data - All fields are passed along as-is (overriding pre-defined fields if any)
- Only
markandencodingfields are required as the bare-minimum
vegalite-custom:
  title: Custom Vega-Lite chart
  db: demo
  query: |
    SELECT browser, sessions
    FROM (VALUES
      ('Firefox', 340),
      ('Chrome', 1020),
      ('Safari', 280)
    ) AS browser_stats(browser, sessions)
  library: vega-lite
  display:
    mark: bar
    encoding:
      x:
        field: browser
        type: nominal
      y:
        field: sessions
type: quantitativeAvailable configuration for markdown chart:
| Property | Type | Description |
|---|---|---|
library |
string |
Must be set to markdown |
display |
string |
Multi-line string containing the Markdown content |
settings |
object |
Markdown settings (see below) |
notes-block:
  library: markdown
  display: |
    ### Dashboard notes
    - Data refreshed hourly
    - Source: internal warehouse
  settings:
    extensions: [markdown.extensions.tables]
    extra_tags: [] # optional
    extra_attrs: {} # optional
Note :
- Some common properties do not apply and can be omitted:
title,db,query - Markdown rendering is done by
datasette-render-markdown - To configure Markdown rendering, use the
settingsproperty.
Available configuration for Markdown rendering:
| Property | Type | Description |
|---|---|---|
extensions |
array |
List of extension entry points to enable |
extra_tags |
array |
List of extra tags to allow |
extra_attrs |
object |
Mapping of tags to extra attributes allowed for them |
Note :
- These arguments are passed to the
render_markdown()function. - The
extra_tagsandextra_attrsare passed to Bleach.extra_attrsis indeed required to be given as a dict.
Available configuration for metric chart:
| Property | Type | Description |
|---|---|---|
library |
string |
Must be set to metric |
display.field |
string |
Numerical field to be displayed as metric |
display.prefix |
string |
Prefix to be displayed before metric |
display.suffix |
string |
Prefix to be displayed after metric |
active-users:
  title: Active users
  db: demo
  query: |
    SELECT active_count
    FROM (VALUES
      (932)
    ) AS totals(active_count)
  library: metric
  display:
    field: active_count
    prefix: "~"
    suffix: " users"
Note:
- The
display.fieldmust reference a single-numerical value from the SQL query (e.g. numericalnumberfield inSELECT count(*) as number FROM events)
There is no required configured in display, so you can either ignored or
leave it empty for table charts.
Some advice for a nice table chart:
- Set proper column names in the
SELECTclause - Limit the number of columns in the
SELECTclause - Limit the number of rows with the
LIMITclause - Order the rows explicitely with the
ORDER BYclause - Use SQLite string concatenation operator (
||) to format column data (for instance to include HTML markup!)
recent-orders:
  title: Recent orders
  db: demo
  query: |
    SELECT order_id, customer, total
    FROM (VALUES
      (101, 'A. Smith', 129.50),
      (102, 'B. Chen', 88.00),
      (103, 'C. Diaz', 244.10)
    ) AS orders(order_id, customer, total)
    ORDER BY order_id DESC
  library: table
display: {}Available configuration for map chart:
| Property | Type | Description |
|---|---|---|
library |
string |
Must be set to map |
display.latitude_column |
string |
Name of the latitude column (default: latitude) |
display.longitude_column |
string |
Name of the latitude column (default: longitude) |
display.show_latlng_popup |
boolean |
Whether or not to display latitude and longitude values in popup (default: false) |
warehouse-locations:
  title: Warehouse locations
  db: demo
  query: |
    SELECT name, latitude, longitude
    FROM (VALUES
      ('Paris', 48.8566, 2.3522),
      ('Lyon', 45.7640, 4.8357),
      ('Marseille', 43.2965, 5.3698)
    ) AS warehouses(name, latitude, longitude)
  library: map
  display:
    latitude_column: latitude # optional
    longitude_column: longitude # optional
show_latlng_popup: false # optionalWarning: do not try to load more than a thousand rows for a map at the risk of
slugginess and being unreadable. Make sensible use of the LIMIT clause to reduce
the number of items to display on the map.
The default dashboard layout will present two charts per row (one per row on mobile).
To make use of custom dashboard layout using CSS Grid Layout,
define the layout array property as a grid / matrix:
- Each entry represents a row of charts
- Each column is referring a chart by its property name
- An empty slot in the grid can be specified using the
.(full stop) placeholder
WARNINGS:
- All rows must specify the same number of columns
- All charts must be placed somewhere on the custom layout
Here is a simple 2x3 grid example with 4 different charts:
layout:
  - [chart1, chart2, chart3]
  - [chart1, chart4, chart4]
Here is a more subtle example involving an empty spot at the end of the second row:
layout:
  - [chart1, chart2, chart3]
- [chart1, chart4, .]Dashboards can be embedded within an HTML page using an iframe element:
<iframe
  src="/-/dashboards/my-dashboard/embed?start_date=2023-01-01&end_date=2023-12-31"
  frameborder="0"
  width="100%"
  height="600"
  allowtransparency
>
</iframe>
Same goes for charts:
<iframe
  src="/-/dashboards/my-dashboard/my-chart/embed?start_date=2023-01-01&end_date=2023-12-31"
  frameborder="0"
  width="100%"
  height="600"
  allowtransparency
>
</iframe>To set up this plugin locally, first checkout the code. Then create a new virtual environment and the required dependencies:
uv syncTo run the QA suite:
uv run invoke qaIndividual tasks are also available:
uv run invoke format   # auto-format code
uv run invoke lint     # run ruff linter
uv run invoke typing   # run mypy type checker
uv run invoke test     # run test suite with coverage
uv run invoke shots # take screenshots of the local demoExternal JS dependencies are tracked and bundled using NPM and package.json (package-lock.json is not needed here):
npm install --no-package-lockWith the developmnent environment setup, you can run the demo locally:
uv run datasette \
  --metadata demo/metadata.yml \
  --template-dir demo/templates \
demo/jobs.dbLicensed under Apache License, Version 2.0
Copyright (c) 2021 - present Romain Clement